
Find out where your business is leaking value.
Data Preprocessing Mastery
Analyse your sales, customers, costs, and payments to find what’s working and what’s not.
We work with your real business data — sales records, customer databases, payment logs, inventory systems — and turn it into a clear picture of performance. Revenue by product, customer retention patterns, outstanding payments, overstocked inventory — we find where you’re losing money and tell you what to fix first.
Everything is delivered in Excel and Power BI with specific, prioritised recommendations you can act on immediately.
What´s Included
- Revenue diagnostics: breakdown by product/service/segment, trend analysis
- Cost analysis: cost structure mapping, margin by product, waste identification
- Customer analytics: new vs returning, churn indicators, segment analysis
- Payment tracking: outstanding payments, ageing analysis, collection patterns
- Inventory analysis: stock turnover, slow movers, overstock identification
- Recommendations report with prioritized actions

What You´ll Receive
What You’ll Receive | • Analytics report (Word/PDF) with findings and recommendations • Data analysis workbook (Excel) with structured data and calculations • Power BI report (for larger/complex datasets) • Executive summary with top 3–5 prioritised actions |
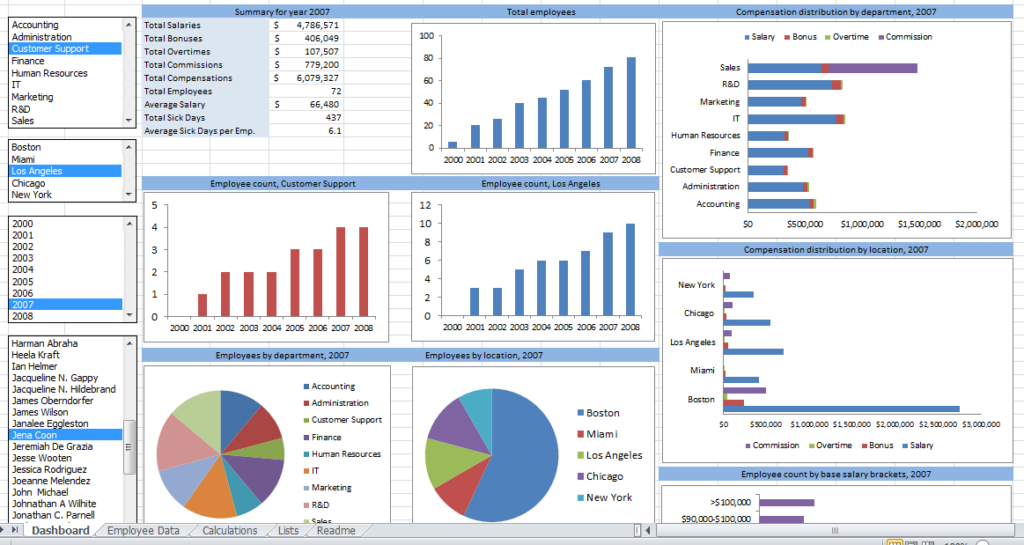
See your key numbers at a glance, updated in real time.
Custom Excel and Power BI dashboards that track your key business metrics.
Custom-built dashboards that track the metrics that matter most to your business. We define the right KPIs, build the dashboard, connect your data, and train you to use it.
Designed for business owners, not data analysts — clean, readable, and easy to update. You get ongoing visibility without ongoing dependency.
What´s Included
- KPI definition: identify the 5–15 metrics that matter most
- Dashboard design and build in Excel or Power BI
- Data connections to your existing sources
- Automated calculations and real-time metric tracking
- Clean visual design for non-technical users
- User guide with documentation
- Training session to walk you through the dashboard

What You´ll Receive
What You’ll Receive | • Interactive dashboard (Excel workbook or Power BI report) • User guide (Word/PDF, 3–5 pages) • KPI definition reference document • Training/handover session |